Dissimilarity-based Networks
Source:vignettes/dissimilarity_networks.Rmd
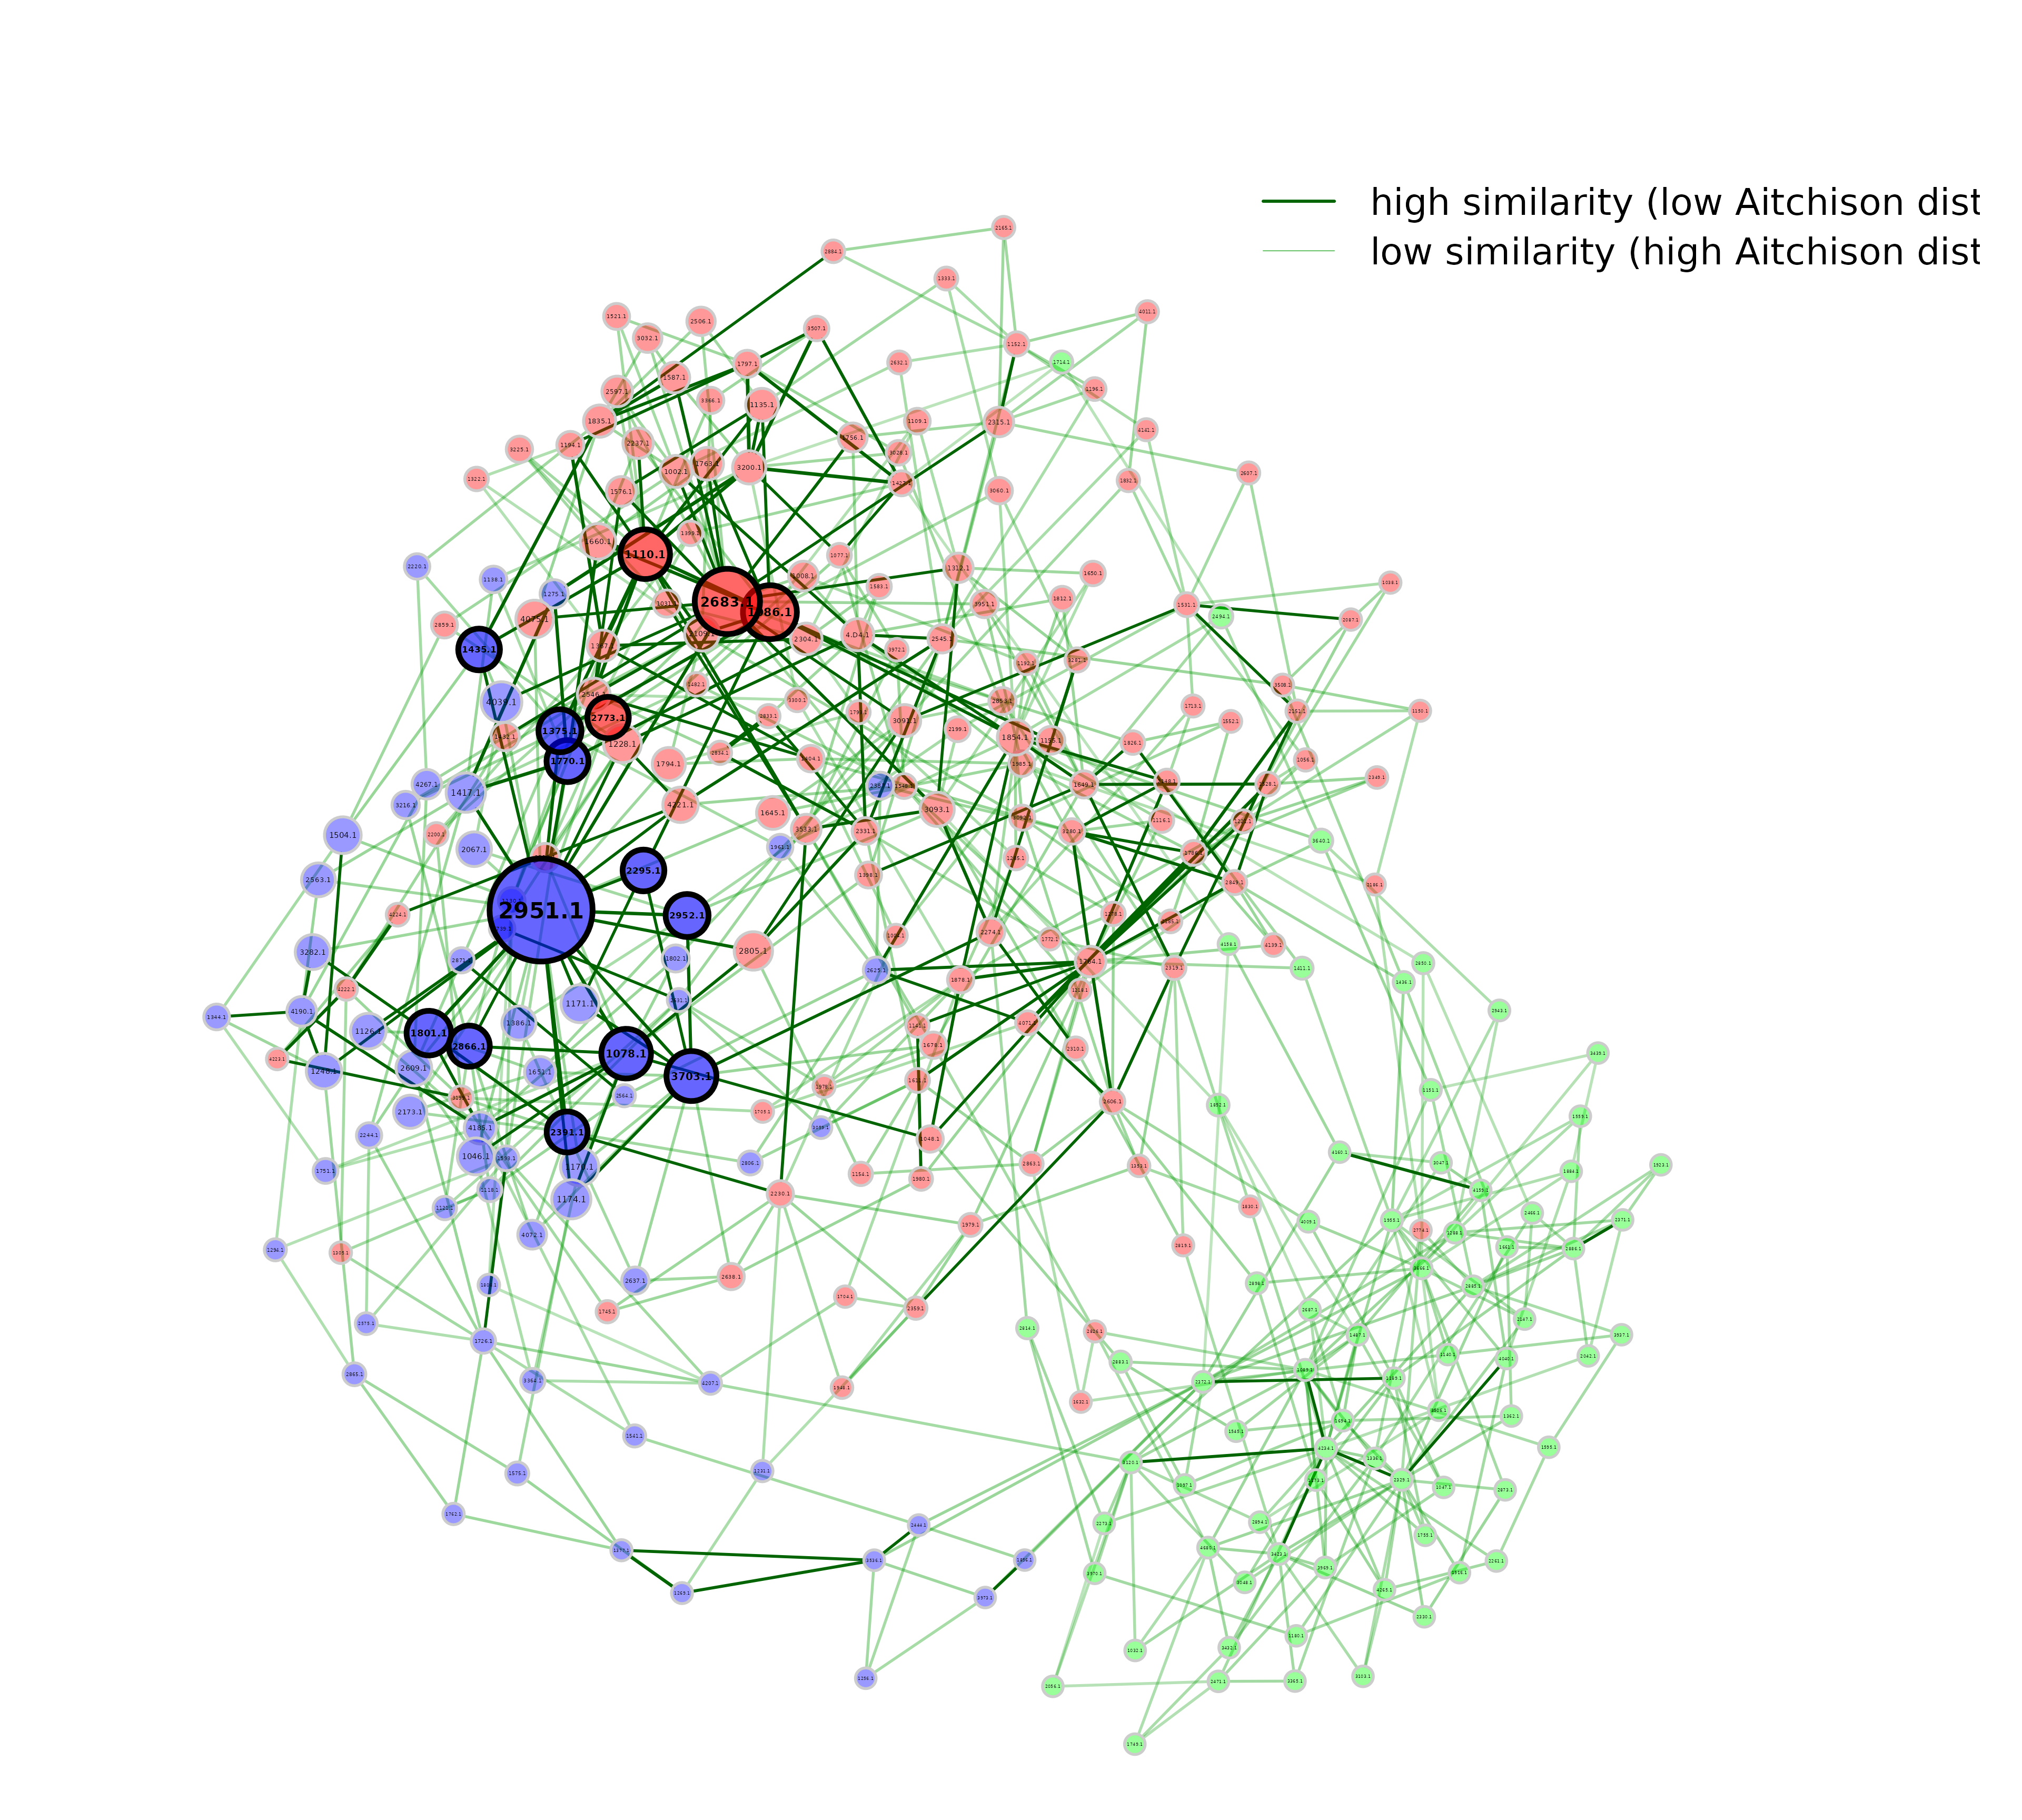
dissimilarity_networks.RmdIf a dissimilarity measure is used for network construction, nodes are subjects instead of OTUs. The estimated dissimilarities are transformed into similarities, which are used as edge weights so that subjects with a similar microbial composition are placed close together in the network plot.
We construct a single network using Aitchison’s distance being suitable for the application on compositional data.
Since the Aitchison distance is based on the clr-transformation, zeros in the data need to be replaced.
The network is sparsified using the k-nearest neighbor (knn) algorithm.
data("amgut1.filt")

net_diss <- netConstruct(amgut1.filt,
                         measure = "aitchison",
                         zeroMethod = "multRepl",
                         sparsMethod = "knn",
                         kNeighbor = 3,
                         verbose = 3)
#> Checking input arguments ... Done.
#> Infos about changed arguments:
#> Counts normalized to fractions for measure "aitchison".
#>
#> 127 taxa and 289 samples remaining.
#>
#> Zero treatment:
#> Execute multRepl() ... Done.
#>
#> Normalization:
#> Counts normalized by total sum scaling.
#>
#> Calculate 'aitchison' dissimilarities ... Done.
#>
#> Sparsify dissimilarities via 'knn' ... Done.
For cluster detection, we use hierarchical clustering with average
linkage. Internally, k=3 is passed to cutree()
from stats package so that the tree is cut into 3
clusters.
props_diss <- netAnalyze(net_diss,
                         clustMethod = "hierarchical",
                         clustPar = list(method = "average", k = 3),
                         hubPar = "eigenvector")
plot(props_diss,
     nodeColor = "cluster",
     nodeSize = "eigenvector",
     hubTransp = 40,
     edgeTranspLow = 60,
     charToRm = "00000",
     shortenLabels = "simple",
     labelLength = 6,
     mar = c(1, 3, 3, 5))

# get green color with 50% transparency
green2 <- colToTransp("#009900", 40)

legend(0.4, 1.1,
       cex = 2.2,
       legend = c("high similarity (low Aitchison distance)",
                  "low similarity (high Aitchison distance)"),
       lty = 1,
       lwd = c(3, 1),
       col = c("darkgreen", green2),
       bty = "n")
In this dissimilarity-based network, hubs are interpreted as samples with a microbial composition similar to that of many other samples in the data set.